
School Budget Excel Template – Free NZ Guide (2026)
Accounting & GST
Fonterra Payout Forecast Excel - Free Template
Forecast Fonterra milk payouts, milk solids, costs and net margin with a simple NZD workbook.
2026-07-07
236 downloads
4.8/5 average rating
Download template
This Fonterra payout forecast Excel template helps you estimate milk income in NZD by season, supplier and scenario. It includes a Forecast Model sheet, a Payout Summary sheet and an Instructions sheet so you can track milk solids, payout assumptions, costs and net milk margin in one place.
Use it when you want a quick view of what a payout change means for cash flow, especially before a meeting with the bank, the accountant or the farm advisory team. The workbook is built for NZ dairy numbers, with forecast GST-exclusive values and a clean summary you can read at a glance.
The key benefits of this Excel template
- Shows forecast milk income from milk solids in kgMS, so you can test payout changes before the season ends.
- Calculates gross milk income, costs and net milk margin in NZD in one sheet.
- Lets you compare payout scenarios side by side, such as base, improved and downside cases.
- Helps you see the effect of supplement and freight costs on margin, not just headline payout.
- Gives you a tidy summary for a farm owner, sharemilker or adviser meeting.
- Supports faster month-by-month planning when you are checking whether the season will cover drawings and bills.
- Keeps the model simple enough to update in Excel without needing farm software.
Step-by-step guide
- Open the Forecast Model sheet and enter each forecast line with the date, farm or supplier name, region and herd size. Use one row per farm or payout scenario so the numbers stay easy to read.
- Enter your milk solids forecast in kgMS and add the base payout you expect in $/kgMS. If you want to test a better or worse season, choose the payout scenario and enter the adjustment.
- Add any contracted milk supply, supplement cost and freight or collection cost. The sheet then shows gross milk income, net milk margin and margin %.
- Check the Scenario Lookup Table on the right-hand side of the model. This is where the payout adjustment values are stored so you can keep assumptions consistent.
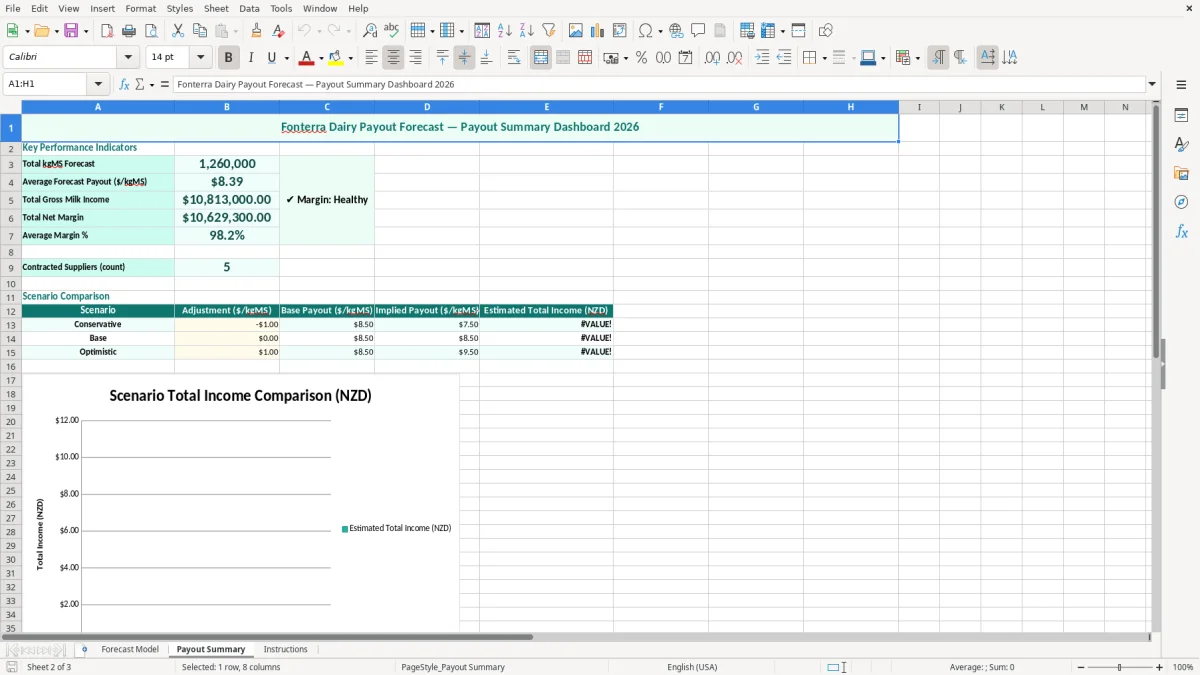
- Review the Payout Summary sheet to see the results pulled into a cleaner view. Use it when you want to compare suppliers, regions or forecast periods without scrolling through every line.
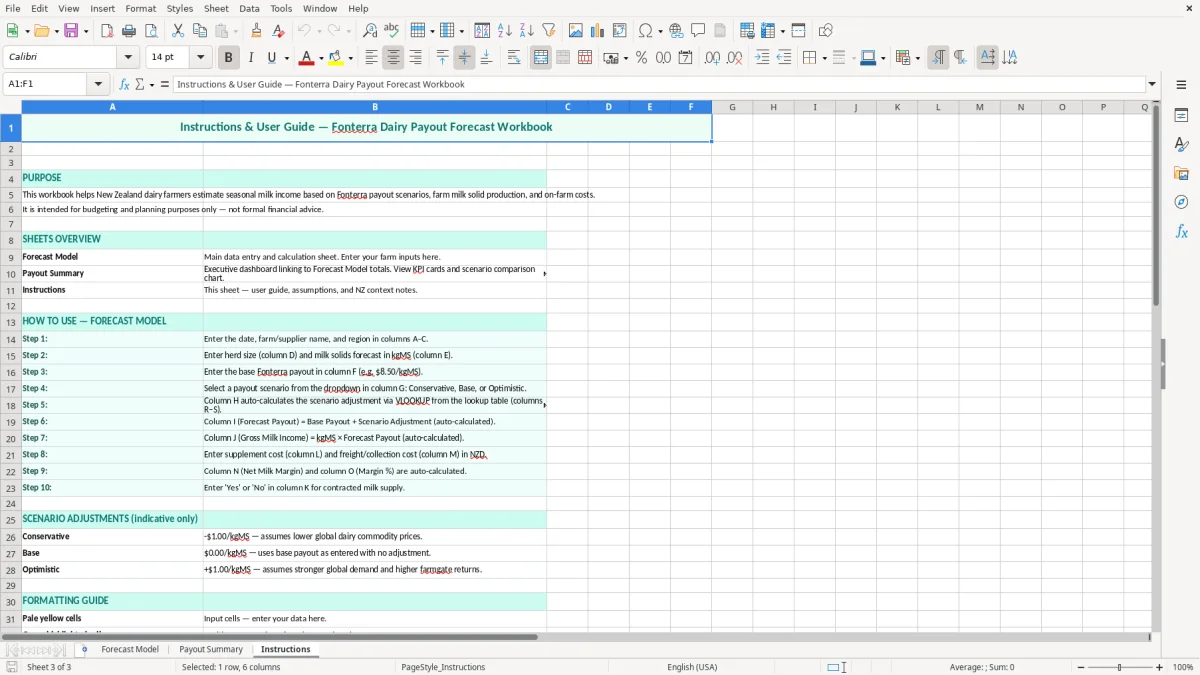
- Read the Instructions sheet before changing formulas. If you are updating the model for a new season, copy the existing rows first so you keep the structure intact.
Included features
Forecast Model sheet with 16 columns for payout planning, margin tracking and notes.
Scenario Lookup Table for quick payout adjustment checks by $/kgMS.
Built-in fields for milk solids forecast, base payout and adjusted payout.
Cost inputs for supplement and freight or collection so you can see net margin, not just income.
Margin % calculation to show how much of gross milk income is left after costs.
Payout Summary sheet for a clearer readout of the forecast results.
Instructions sheet to help you update the workbook without breaking formulas.
Who uses a dairy payout forecast in New Zealand
This workbook suits the people who need a fast read on the season, not a full farm management system. A sharemilker checking whether 180,000 kgMS at $8.20/kgMS will cover costs, a farm owner planning drawings, or a rural bookkeeper helping a client before the 31 March balance date can all use it.
It is especially handy around the payout announcement cycle, when a difference of just $0.25/kgMS matters. On a 120,000 kgMS farm, that is a swing of $30,000 before you even look at supplement, freight or finance costs.
When the sheet earns its keep
You will usually pull it out when the bank wants a season estimate, when you are setting drawings, or when milk income is being compared with fertiliser and feed spend. If your numbers are 12,000 kgMS short, the template makes that gap visible before it becomes a cash flow problem.
What image 1 shows
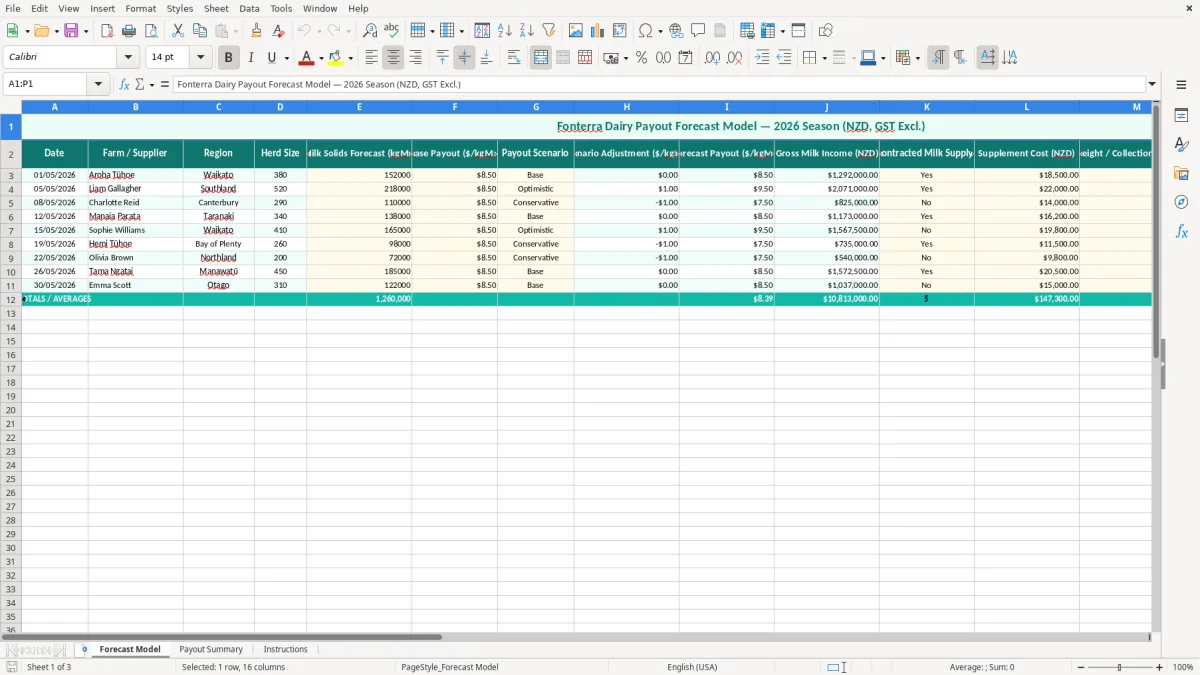
Image 1 shows the Forecast Model laid out like a working worksheet, with a title row, a wide input table and a scenario lookup area on the right. The columns are set up for date, farm or supplier, region, herd size, kgMS, payout assumptions, costs, margin and notes, so you can keep one line per forecast entry.
The summary at the top is not a dashboard full of fluff. It is a practical model for the numbers you are already talking about at the kitchen table or in the office after milking.
What IRD and GST mean for payout forecasts
This is a forecasting sheet, but the numbers still need to line up with New Zealand tax rules. Dairy income is usually tracked in GST-exclusive terms here, and if you are registered you need to keep your records for 7 years under Inland Revenue rules.
The practical choice is to keep the forecast separate from your actual GST return. If your model shows $240,000 of milk income on 30,000 kgMS at $8.00/kgMS, that is a planning figure; your filed return still needs the real invoices, adjustments and credits.
How to keep the model tax-ready
Use a clear balance date view, especially if you are a sole trader or company filing alongside a farm entity. A standard provisional tax setup may run off the 31 March year end, so a season forecast that shows income building from July to May helps you see when the terminal tax pressure will land.
If you add Fonterra milk schedules, keep them separate from any IRD number, NZBN or entity details you use for bookkeeping. For a company, the forecast supports the IR4; for a sole trader it helps feed the IR3, but it does not replace proper accounting entries.
A good test is simple: if you forecast a $1,500 rise in freight and a $2,000 lift in supplement, does the model show the margin drop clearly? If it does, you have a useful planning tool rather than just a payout guess.
Where dairy payout forecasts usually go wrong
The biggest mistake is treating payout as the only number that matters. A farm on 150,000 kgMS can look fine at $8.50/kgMS, then lose $22,500 of margin once you add $0.15/kgMS in extra feed and freight costs.
Ignoring the cost line
People often forecast gross milk income and stop there. That is how you end up with a season that looks profitable on paper but leaves no room for drawings, finance or repairs.
Mixing assumptions with actuals
Another common problem is changing the base payout in one row and forgetting to update the scenario adjustment in the next. On a sheet like this, one wrong $0.10/kgMS assumption across 200,000 kgMS means a $20,000 error, which is enough to distort a budget meeting.
Letting notes replace numbers
Some users write long comments instead of entering the cost. That makes the workbook hard to use later, especially when you are comparing three farms, two suppliers or a season split across different regions.
The fix is to keep the working figures in the table and use the notes column only for context. That way, when someone opens the file in six months, they can still see why the forecast moved and what the margin was supposed to do.
How to make the forecast part of your weekly routine
The easiest way to keep this sheet alive is to tie it to an existing habit, like the weekly farm meeting or the monthly accounts review. If you update it every Friday with the latest milk solids and costs, you will spot drift long before the end of the season.
Simple habits that keep it useful
- Copy the prior month’s rows instead of rebuilding the forecast from scratch.
- Use the scenario lookup values instead of typing new payout assumptions every time.
- Check the margin % after each update so you can see whether income growth is being eaten by costs.
- Keep one version for planning and one for actuals so you do not overwrite the working model.
If you are entering more than a few farms or suppliers, Excel will still handle it well, but once you need linked bank feeds, full reconciliation or multi-entity reporting, you are probably into Xero or MYOB territory. This sheet is best when you want a quick, controlled model that one person can maintain in under 10 minutes.
That same controlled setup is also where a look-through income model fits neatly when you need to track pass-through payouts without turning the file into a full accounting system.
Common questions about this template
It is a forecast model, so you use it to estimate payout, income and margin before the season is final. You can still compare it with actual milk statements later, but it is built for planning rather than posting accounting entries.
No, the model is set up in NZD GST-exclusive terms so you can keep the forecast clean. That makes it easier to compare with your accounts and your GST return work without double-counting tax.
Start with milk solids forecast in kgMS, then add your base payout per kgMS and any scenario adjustment. After that, enter supplement and freight or collection costs so the net milk margin has something meaningful behind it.
Yes. The Forecast Model is built with one row per entry, so you can track different farms, suppliers or regions in the same workbook and compare them in the Payout Summary sheet.
Weekly is ideal during the season, especially if milk solids or feed costs are moving. If that is too much, update it at least once a month so the numbers stay close enough to be useful.
Move on once you need live bank feeds, multiple users editing at once, or full accounting and reconciliation. If you are just testing payout scenarios and checking margin, Excel is usually the quicker and cleaner option.
Download
File format
Excel (.xlsx)
Compatible software
Excel, Google Sheets, LibreOffice
Price
Free